A Deeper Dive with the Data
Does Post Position Impact Probability to Win or ROI at Saratoga?
Data Speaks Louder than Words
This is a follow-up to our recent blog that drove much discussion and debate. We may bore you with data/math here, but tis the only way to make the doubters – smarter.
We can explain it again but we can’t understand it for you.
The Data Set (Same Data)
- 10 years of data from Saratoga (2012-2021)
- Note you need tons of data to statistically prove a bias
- All races have at least 8 horses running and no more than 10 horses
- Note: you need a larger field to determine a PP bias
- All races on FAST DIRT
- Excluding races with dead heats, entries and DQs
- Clean & rich sample of 589 Races with 5,141 horses ran
(Note: Final Post Positions are utilized accounting for scratches – not their Horse Number or Post-Position in the Racing Form. For example, if the #1 scratches the #2 now has PP1)
The Analysis & Results (with the Raw Data)
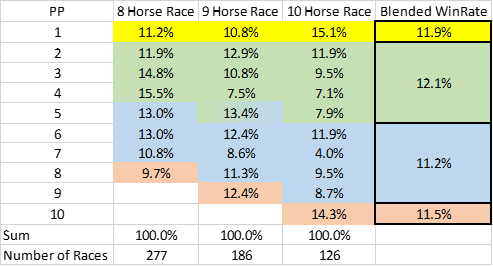
BTSM segmented the postpositions into 4 segments for hypothesis testing (and a little extra analytics).
- PP1 is the post (our subject of the analysis)
- Inside middle (e.g. in a 10 horse race PP 2-5)
- Outside middle (e.g. in a 10 horse race PP 6-9)
- Outside (e.g. in a 10 horse race the 10 PP)

Note: in the 9 Horse Race we took PP5 partial as a Inside Middle and Outside Middle (see shading)
WINRATE
A strong topic of contention… and hopefully readers see there is absolutely no difference between Post Position and winning. If you are handicapping to the probability of winning on Fast Dirt Tracks at Saratoga – Post Postion should not be considered a variable you should examine.
(Note: this is not to say there may be short-term non-statistically significant bias for a week or 2)
WinRates add to 100% per Race – make sense?
Hopefully we closed the door on the debate here.
Closing note here on the question …
“PP1 has 11.2%, 10.8%, and 15.1%?... the average is 12.3% not 11.9%”
Blended WinRate is weighted by the number of races; there were 277 Races with 8 Horses Running and therefore weighted higher than the 15.1% WR from the 126 Races with 10 horses.
PAYOUTS
Now – a bit more difficult.
When each of these 589 races run, and we have 589 winners – what is the Payout on a $2 Win bet by Post Position??
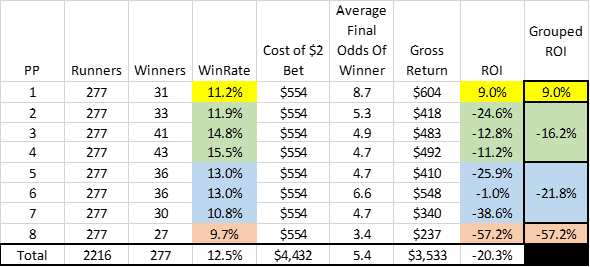
Here we go…. Let us start with the 8 Horse Races (277 Races)

Now with 9 Horse Races (186 Races)

And, finally, 10 Horse Race (126 Races)

PP1
Has a WinRate of 11.9% -- hope we proved that above.
Over the course of these 589 races we bet $1,178 ($554, $372 and $252) of $2 Win bets on PP1.
We were returned $1,192 (Gross) on the 70 winners.
ROI = (Gross Return – Investment) / Investment = ($1,192 - $1,178) / $1,178 = drum roll… +1%
Outside PP (PP8 in an 8 horse Race, PP9 in a 9 Horse Race, ….)
Has a WinRate of 11.5%.
Over the course of these 589 races we bet $1,178 ($554, $372 and $252) of $2 Win bets on Outside PP.
We were returned $649 (Gross, $237, $200 and $212) on the 68 winners.
ROI = (Gross Return – Investment) / Investment = ($649 - $1,178) / $1,178 = -45%
Therefore…..


Fan Busted (AGAIN)? (YES)
Data is information. And information is power.
Advanced statistics and analytics is the core of the BTSM value system. Feel free to ping us with your doubts and questions on the above analysis or the next myth to bust (or even a betting friend to educate).
How good is Irad Ortiz Jr. at Saratoga? Hmmm…
Be The Smart Money
Transforming How to Handicap for Value
Get your Smart Sheets for Saratoga and Del Mar at www.BeTheSmartMoney.com
